Background
This survey analyzes the financings of 31 US-based, venture-backed unicorns that raised money in 2016. It also includes comparative data from our prior surveys covering unicorn financings in 2014 and 2015. Our prior surveys are available here and here. We have provided both quarterly and annual information, but bear in mind that the quarterly sample size is necessarily smaller, and accordingly more subject to being affected by an outlier financing.
Overview of Results
- The valuation metrics of unicorn financings weakened in 2016. Specifically:
In 2014 and 2015 almost all unicorn financings were up-rounds. In 2016 the percentage of up-rounds steadily declined, hitting 60% in the fourth quarter. Almost all of the financings that were not up-rounds were flat-rounds. There continue to be very few down-rounds.
Although few of the unicorn financings were down-rounds, 40% of the unicorns that went public or were acquired in 2016 did so at a lower valuation than their last unicorn financing round.
Both the average and median increase in unicorn valuations from their prior financing declined significantly in the last half of 2016. - In addition to a weakening in valuation metrics, the number of US-based, venture-backed unicorn financings has been declining since mid-2015, with 2016 having less financings than not only 2015, but also 2014.
There were 62 financings in 2015 but only 31 in 2016. Of the unicorns that raised money in 2015, 12 raised an additional round in 2016 and 4 went public or were acquired. Many of the 2015 funded unicorns that have not raised additional funds or exited will likely need to either raise additional financing (privately or publicly), be acquired, or significantly reduce their burn rate, within the next 12-18 months. This could put pressure on the unicorn financing markets and cause valuations to be adversely affected.
On the other hand venture funds had a very successful fundraising year in 2016, the markets overall did well in 2016, with the Nasdaq up almost 10%, and potential acquirers are cash rich with healthy stock prices, so there is the ability to continue funding the recent tranches of unicorns if investors believe the value is there. - We did not see significant changes in the non-valuation terms of unicorn financings in 2016.
Almost all unicorn financings in 2016 provided investors with a liquidation preference. Given that the valuation of all unicorns was approximately 5.5X the total liquidation preference of such unicorns (based on data from CBInsights), investors in general continue to be well protected in the event of an acquisition at a price less than they paid.
There was a bit less use of IPO protections in unicorn deal terms in 2016 than in prior years. It is not surprising that acquisition protections are used more than IPO protections, as 54% of the US-based, venture-backed unicorns that were acquired in the 2014-2016 time frame were acquired at less than their last round price, while only 21% of unicorns that went public in that time frame did so below their last round price.
Survey Results
The detailed results of our survey are as follows:
Number of Financings
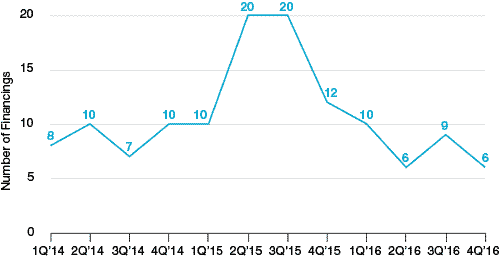
| Results by Year | 2014 | 2015 | 2016 |
| Financings | 35 | 62 | 31 |
Direction of Price Change from Prior Round of Financing
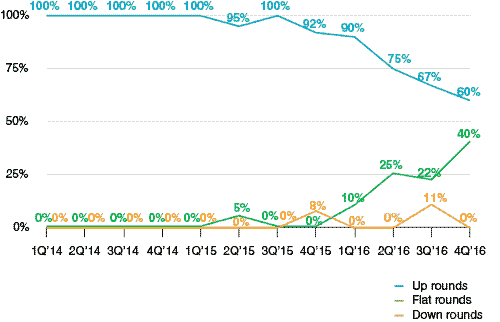
| Results by Year | 2014 | 2015 | 2016 |
| Up-rounds | 100% | 96% | 75% |
| Flat-rounds | 0% | 2% | 21% |
| Down-rounds | 0% | 2% | 4% |
Average and Median Percentage Price Change from Prior Round of Financing
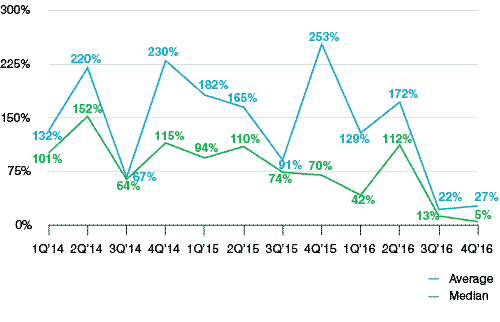
| Results by Year | 2014 | 2015 | 2016 |
| Average Increase | 167% | 162% | 83% |
| Median Increase | 109% | 92% | 30% |
Average Financing Amount
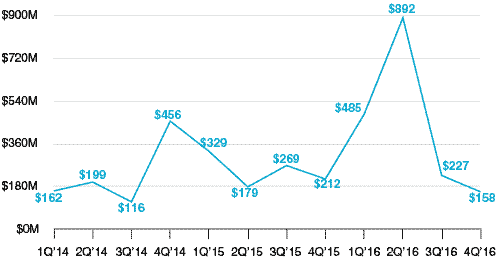
| Results by Year | 2014 | 2015 | 2016 |
| Average Financing Amount | $247M | $239M | $425M |
Acquisition Downside Protections
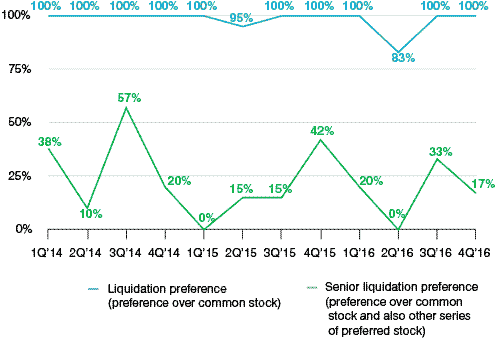
| Results by Year | 2014 | 2015 | 2016 |
| Liquidation Preference | 100% | 98% | 97% |
| Senior Liquidation Preference | 29% | 18% | 19% |
IPO Downside Protections
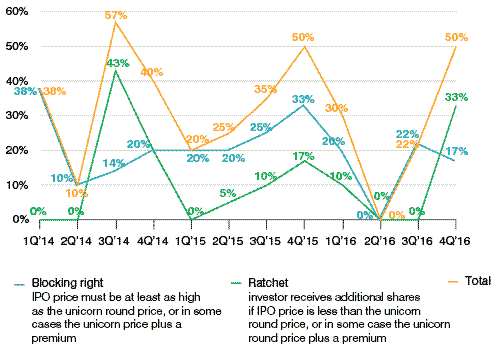
| Results by Year | 2014 | 2015 | 2016 |
| Blocking Right | 20% | 24% | 16% |
| Ratchet | 14% | 8% | 10% |
| Total | 34% | 32% | 26% |
Upside Benefits
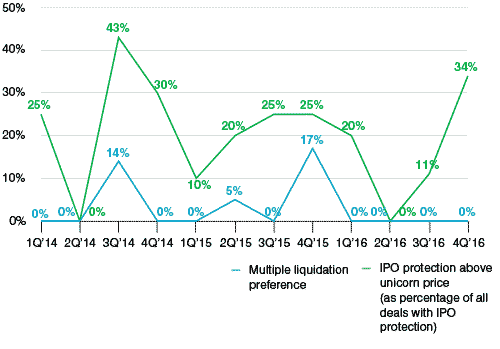
| Results by Year | 2014 | 2015 | 2016 |
| Multiple Liquidation Preference | 3% | 6% | 0% |
| IPO Protection Above Unicorn Price | 23% | 21% | 16% |
Super Voting Stock (Percentage of Financings with Dual Class Common Stock)
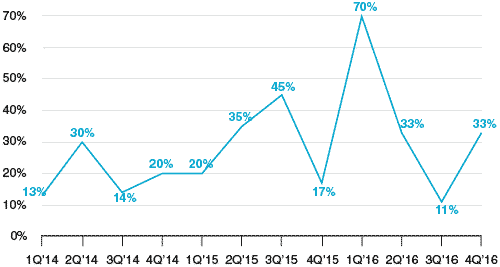
| Results by Year | 2014 | 2015 | 2016 |
| Super Voting Stock | 20% | 32% | 39% |
The recipients of the super voting stock were:
| 2014 | 2015 | 2016 | |
| Founders and/or management | 43% | 35% | 27% |
| Founders and/or management and early investors | 14% | 15% | 36% |
| All pre-IPO shareholders | 43% | 50% | 36% |
Unicorn Exit Valuation Vs. Last Round Valuation
| 2014 | 2015 | 2016* | |
| Acquisitions | |||
| Up | 2 | 0 | 3 |
| Down | 1 | 2 | 3 |
| Total | 3 | 2 | 6 |
| IPOs | |||
| Up | 6 | 2 | 3 |
| Down | 0 | 2 | 1 |
| Total | 6 | 4td> | 4 |
| All Exits Combined | |||
| Up | 8 | 2td> | 6 |
| Down | 1 | 4 | 4 |
| Total | 9 | 6 | 10 |
* in addition there was one acquisition at a valuation approximately equal to the last round valuation
Notes on Methodology
Our survey is limited to US-based, venture-backed, corporations with valuations over $1 billion. Although excluding non-US based and non-venture backed unicorns results in a reduction in the total number of companies included in the survey, we do so because our goal is to provide insight into the US venture environment. We also generally do not include note financings, because unlike equity financings, note financings do not place a valuation on the company.